Ken Wilber and Martin discussing Sex Purpose Love
Ken Wilber with Martin Summer 2016
Martin with his new 832 page book
Sex Purpose Love Front and Back Cover
Order at https://www.amazon.com/Sex-Purpose-Love-Integral-Relationships/dp/0984570330/ or https://integralrelationship.com/tr/shop-integral/
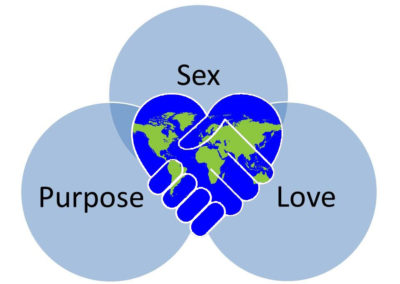
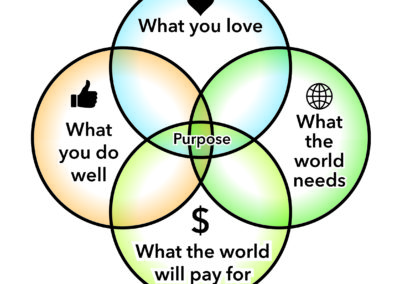
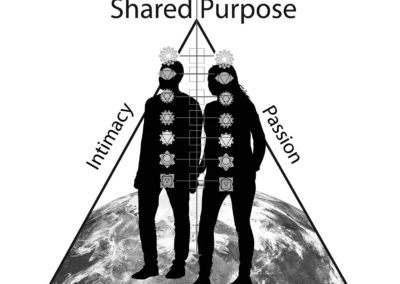
Sex Purpose Love Model
Figure 1. Page xxxix Couples in Integral Love Relationships Creating a Better World
Ignorant Man on Earth
Figure 2. Page xliii Man surveying the heavens as the planet disintegrates
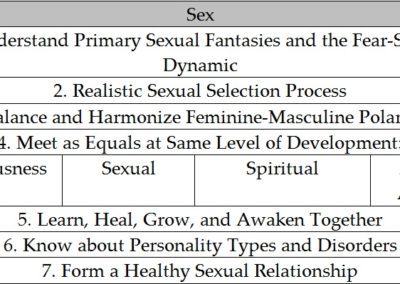
Sex Part of Integral Love Relationship (ILR) Model
Figure 3. 8. and 92. Pages 2, 12 and 467 Sex component of the ILR model
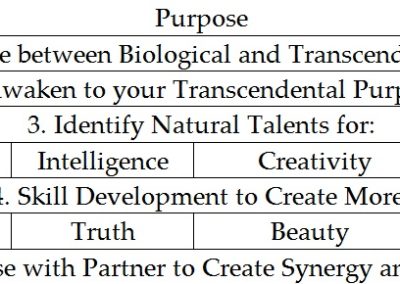
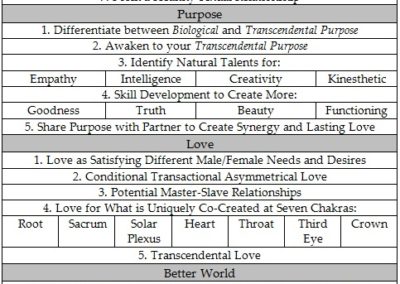
Purpose Part of ILR Model
Figure 4. and 93., Pages 3 and 468 Purpose component of the ILR model
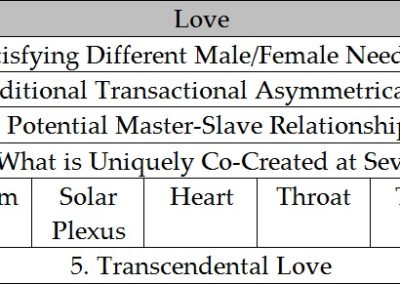
Love Part of ILR Model
Figure 5. and 94. Pages 5 and 469 Love component of the ILR model
Better World Part of ILR Model
Figure 6. 60, and 95. Pages 6, 392, and 471 Making the world a better place – the final component of the ILR model
Entire Integral Love Relationship Model
Figure 7. and 96. Pages 8 and 472 The Entire ILR Model
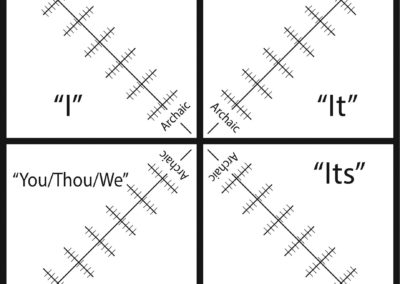
Four Quadrants
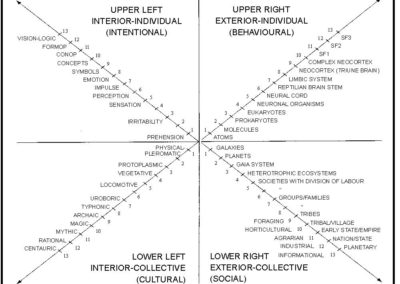
Figure 9, 20, and 50 Page 17, 108 and 302 The four quadrants of the AQAL Model
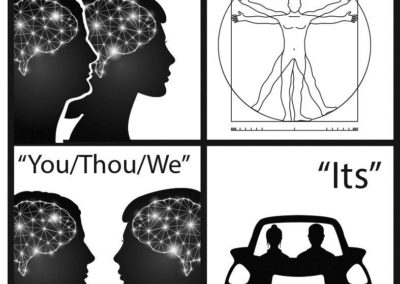
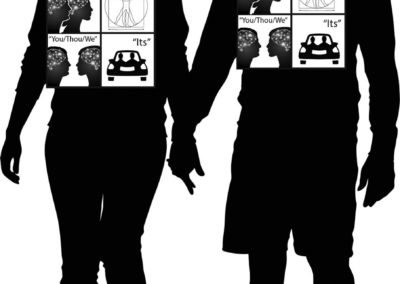
Couple Four Quadrants
Figure 10. Page 23 The four quadrants in Relationships
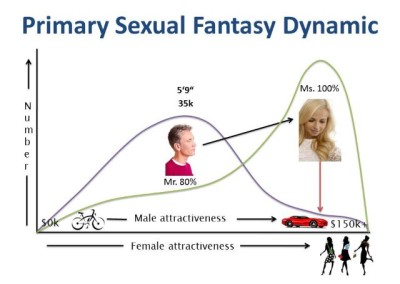
Primary Fantasy
Figure 11 and 70 Page 26 and 417 Primary Sexual Fantasy Dynamic
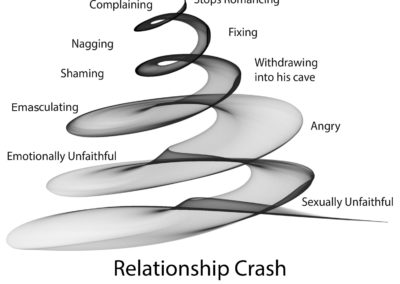
Fear Shame Downward Spiral
Figure 12. Page 27 Fear-Shame Downward Spiral
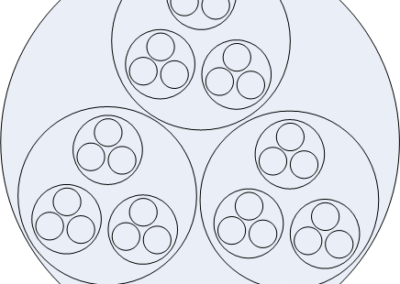
Nested Holons
Figure 13. Page 31 Example showing nested holons
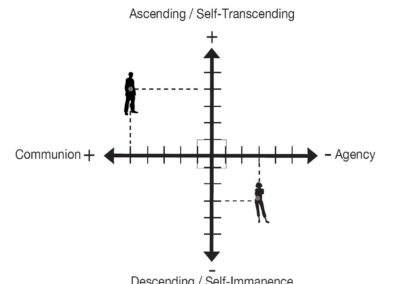
Feminine Masculine Polarities
Figure 14. Page 33 Feminine (Communion-Descending)/Masculine (Agency-Ascending
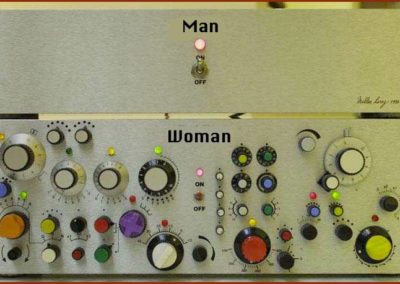
Complexity of Man vs. Woman
Figure 15. Page 59 Joke about divergent psychological complexity of men and women
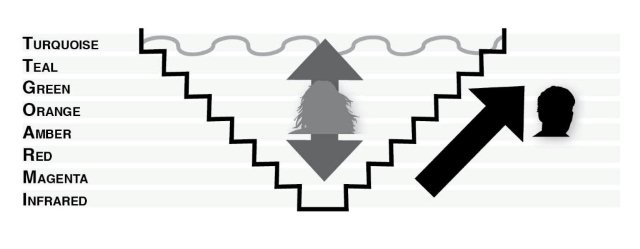
Men grow like banks, Women rise with flow
Figure 16. Page 60 Male-female dynamic in consciousness growth
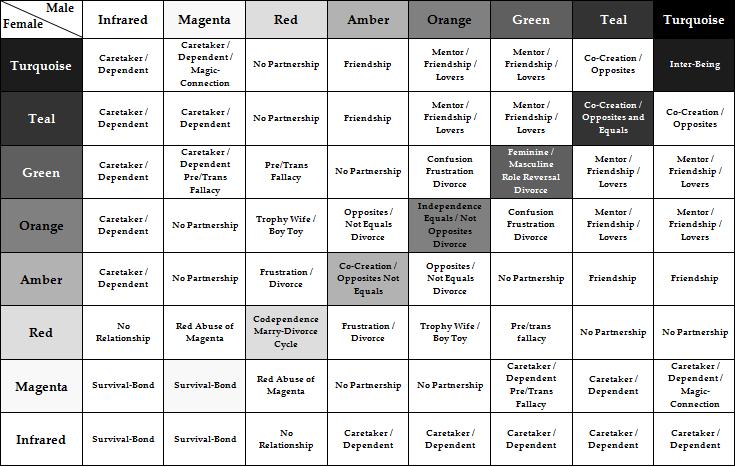
Compatibility Matrix 1
Table 2. Page 61 Compatibility Matrix for men and women at different levels of consciousness development
Compatibility Matrix 2 (Copy)
Table 2. Page 61 Compatibility Matrix for men and women at different levels of consciousness development
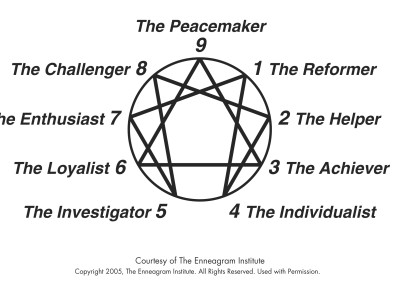
Enneagram
Figure 17. Page 90 The Enneagram
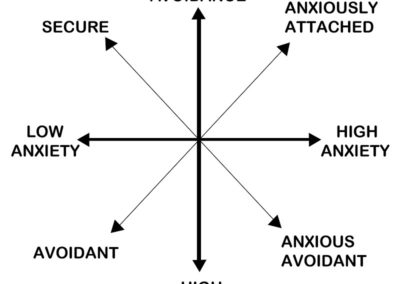
Attachment Styles
Figure 18. Page 98 Attachment Styles
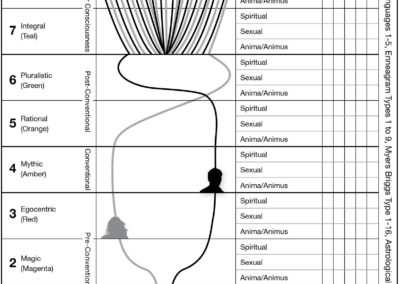
Personality Matrix
Figure 19. Page 102 The Personality Matrix—allowing you to map your development
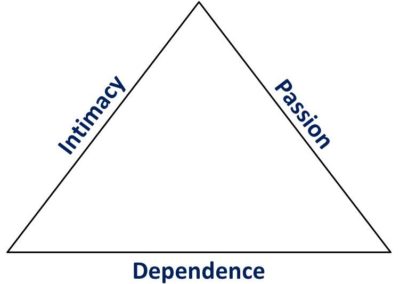
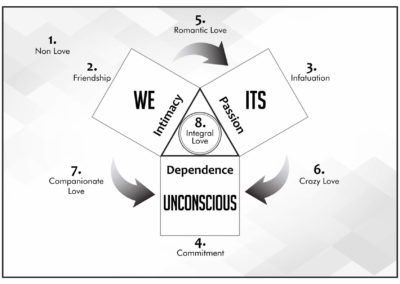
Triangle of Love
Figure 21. Page 125 The passion/intimacy/dependence Triangle
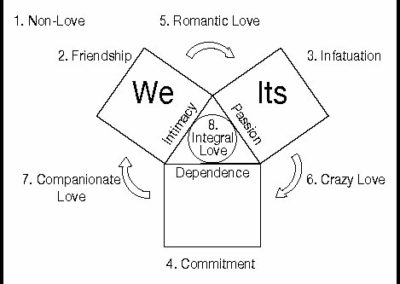
Eight Forms of Love
Figure 22. Page 126 The eight forms of love
Each Partner Embodies Triangle
Figure 23. Page 130 Each lover experiences the combination of passion, intimacy, and dependence
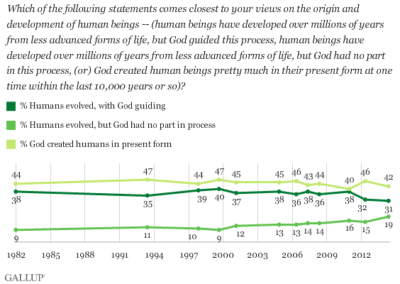
Creationism, Evolution, Intelligent Design
Figure 27. Page 178 Gallup Poll showing different views about origin and development of humans
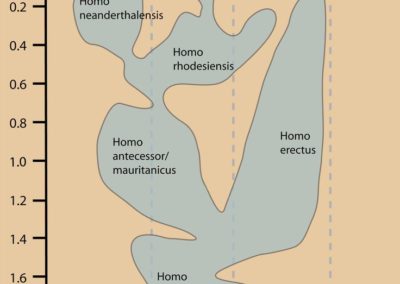
Emergence of Humans
Figure 28. Page 150 Examples showing two triangles overlaid to evaluate the form and quality of love that is experienced
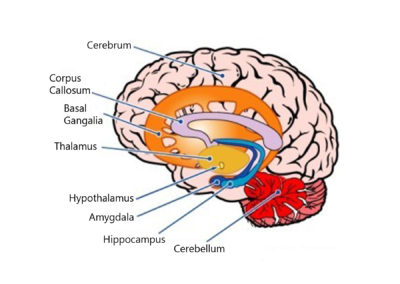
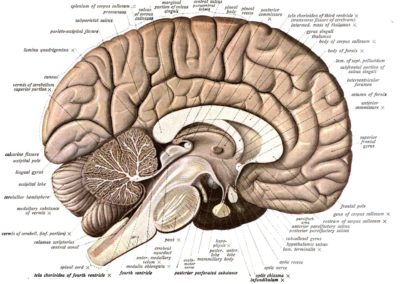
Human Brain
Figure 29. Page 178 Parts of the human brain
Crooked Lines Illusion
Figure 30. Page 183 Optical illusion of straight vs crooked lines
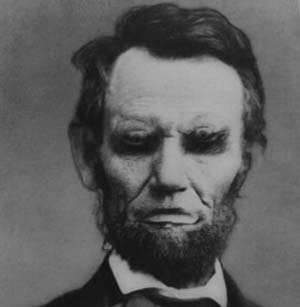
Lincoln Upside Down
Figure 31. Page 184 Photo of Lincoln’s face, inverted
Lincoln … whats wrong?
Figure 32. Page 185 Photo of Lincoln’s face flipped right-side up
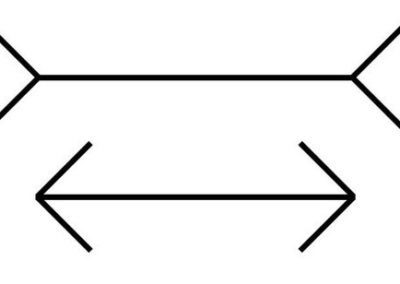
Line Length Illusion
Figure 33. Page 186 Optical illusion of two arrows
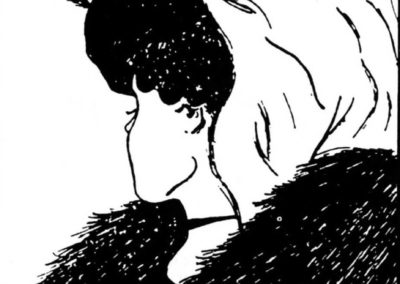
Old and Young Woman
Figure 34. Page 187 Optical illusion – young woman and old woman in a single image
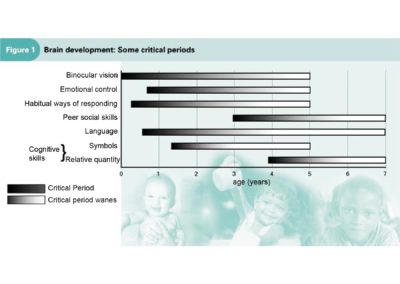
Child Brain Development
Figure 35. Page 189 Critical periods in brain development
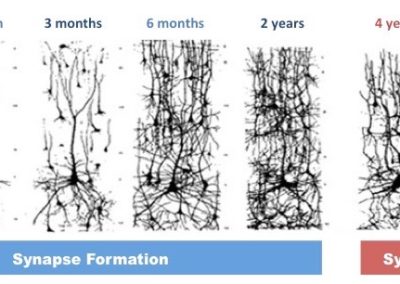
Pruning
Figure 36. Page 193 Synaptic formation and pruning in the brain
Synapse Formation
Figure 37. Page 196 Synapse formation
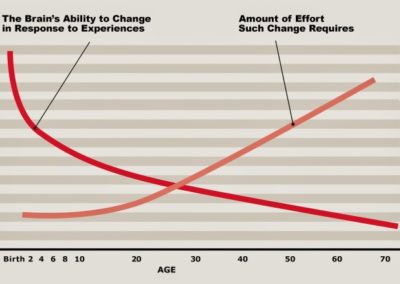
Brain Malleability
Figure 38. Page 196 Age-related decline in formation of synapses
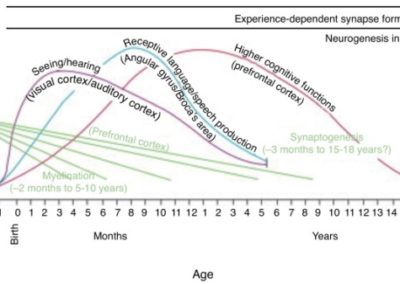
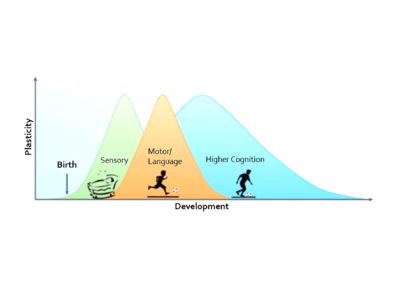
Developmental Phases
Figure 39. Page 199 Brain plasticity and development
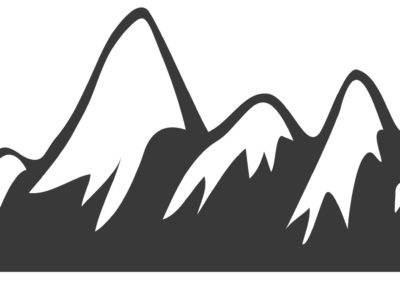
Talent Genetic Predisposition
Figure 40. Page 220 EICK curve as mountain metaphor
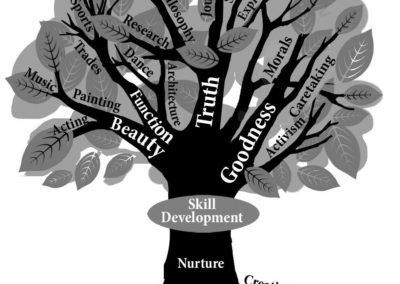
Nature+Nurture+Skill-Development=Purpose
Figure 41. Page 225 Tree metaphor with nature, nurture, skill development and expressions
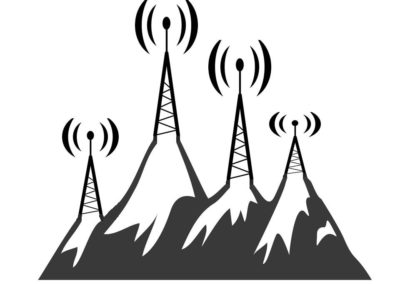
Skill Development
Figure 42. Page 227 The EICK curve as mountain metaphor with differently developed skills
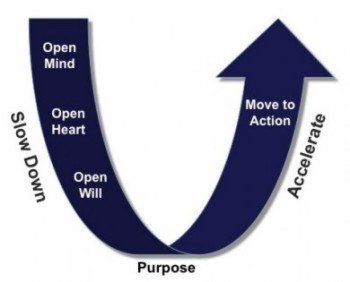
Theory U
Figure 43. Page 251 Otto Scharmer model from Theory U
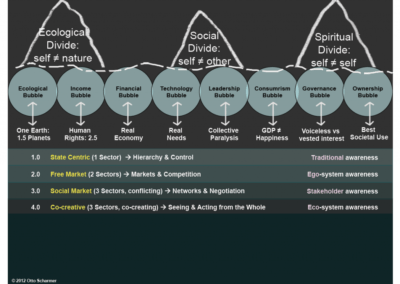
Theory U Disconnects
Figure 44. Page 252 Scharmer and Kaufman – disconnects in humanity
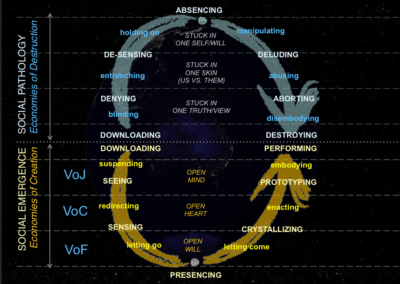
Theory U Process
Figure 45. Page 255 Scharmer’s Theory U process
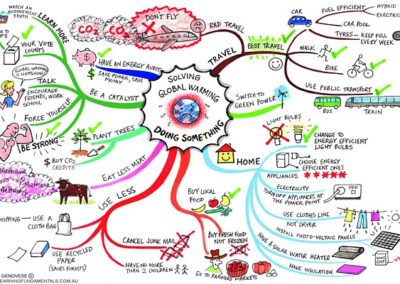
Solving Global Warming Mindmap Example
Figure 46. Page 277 Sample mind map (See more at www.mindmapart.com
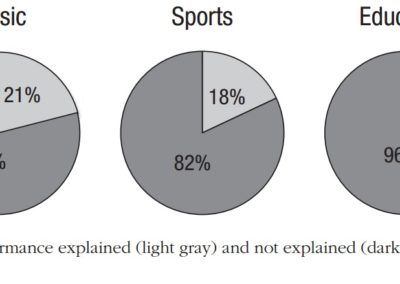
Percentage of practice needed for greatness
Figure 47. Page 279 Performance variation explained by deliberate practice
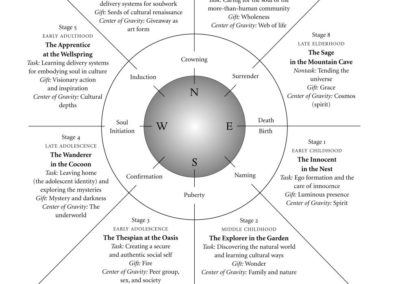
Plotkin’s stages of maturity
Figure 48. Page 295 Plotkin’s eight soulcentric stages of human development
Four Dimensions of Purpose
Figure 49. Page 301 Four dimensions of Transcendental Purpose
Transactional Asymmetric Love
Figure 56. Page 327 Asymmetric Dialectic of Transactional Love
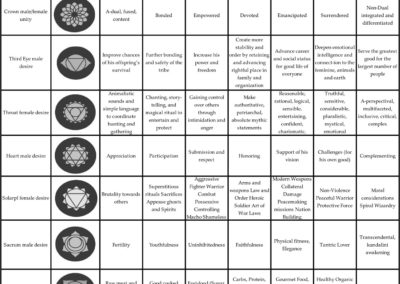
Chakra-Consciousness Lattice Incl. Integral
Table 7. Page 329 Chakra-Consciousness Lattice (in the book, the Integral stage is missing)
Quadrants Altitude Chakras
Figure 57. Page 330 Chakras, human evolution and quadrants
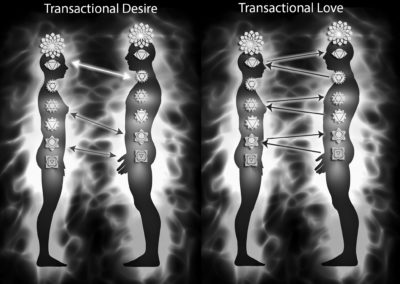
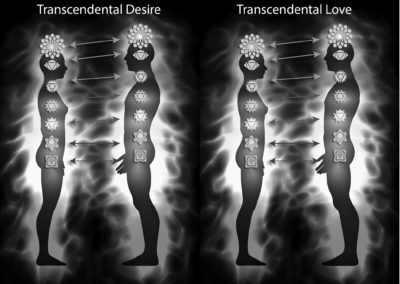
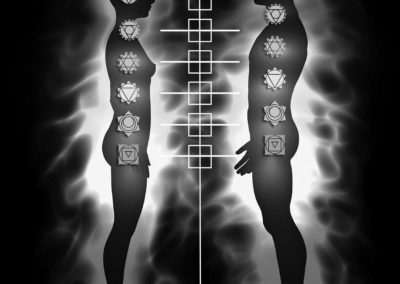
Transcendental Love
Figure 58. Page 381 Connecting with a partner at all chakras
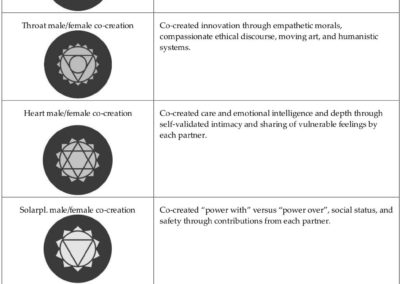
Transcendental Love Matrix
Table 8. Page 385 Chakras and transcendental love
Integral Couples
Figure 59. Page 386 Transcendental Love relationships
Better_World
Figure 60. Page 392 Review of Making the world a better place – the final component of the ILR model
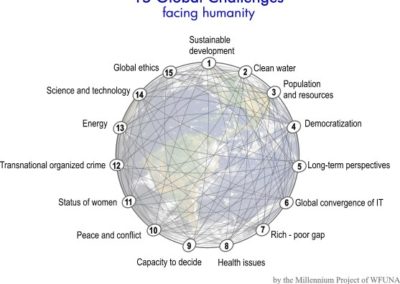
15 Global Challenges
Figure 61. Page 313 Global challenges of our time
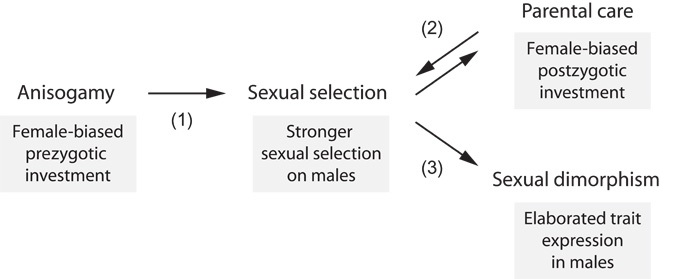
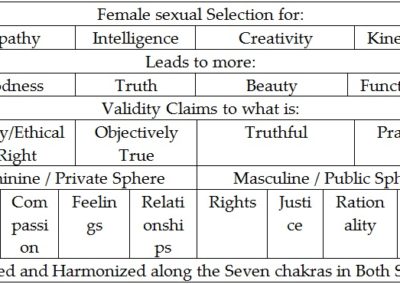
Sexual Selection Traits
Figure 62. Page 404 Dynamic of sexual selection
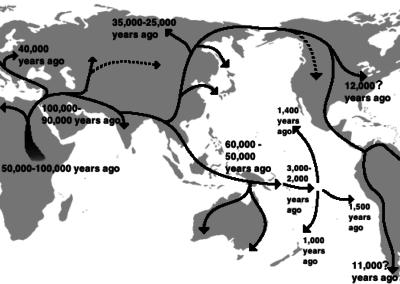
Human Migration
Figure 63. Page 63 Nomadic tribes populating planet Earth
Premodern Co-Creation
Figure 64. Page 411 Couples balancing and harmonizing polarities
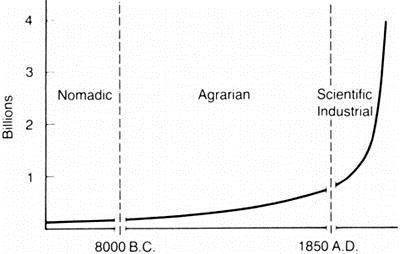
Population_Growth
Figure 65. Page 412 Population growth over time
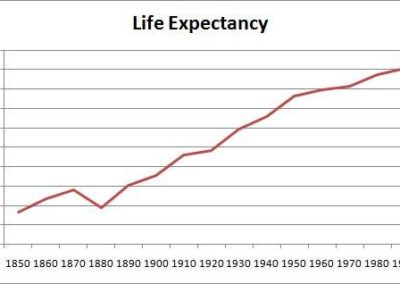
Life_Expectancy
Figure 66. Page 413 Life expectancy over time
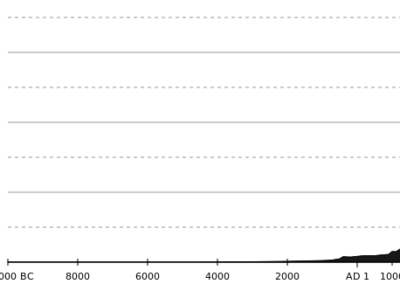
Population_Growth_Detailed
Figure 67. Page 414 Planetary population over time
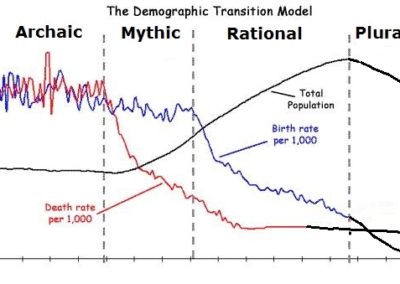
Demographic_Trans_Model_MU
Figure 68. Page 415 Demographic Transition Model
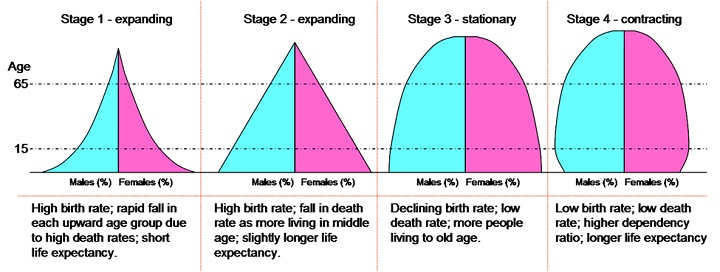
Age_Pyramids
Figure 69. Page 416 Societal models correlated with birth rates
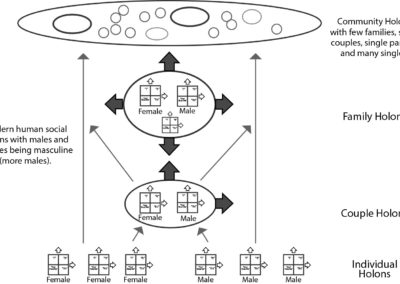
Modern Co-Creation
Figure 71. Page 418 Modern singles co-creating fewer families with fewer children
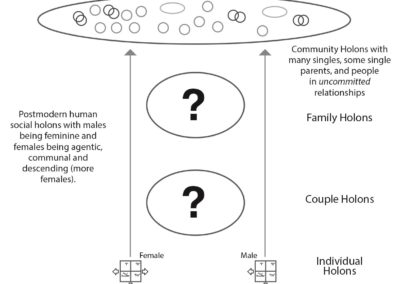
Postmodern Co-Creation
Figure 72. Page 422 Unsustainable communities
Integral Co-Creation
Figure 73. Page 424 Integral communities
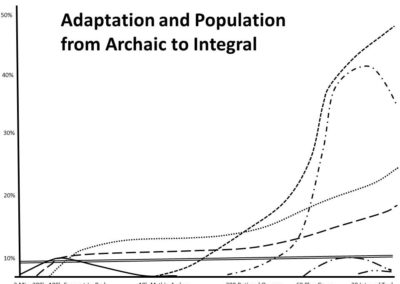
Altitude and Population Growth
Figure 74. Page 425 Graph showing adaptation and population from Archaic to Integral
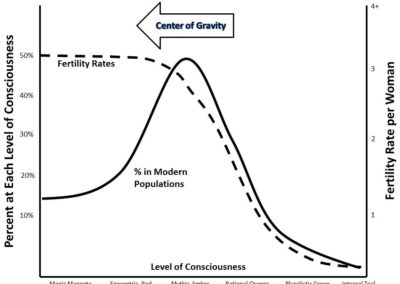
Center of Altitude/Gravity declining
Figure 75. Page 428 Populations in various stages of evolution
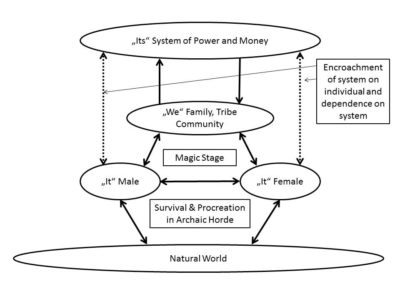
Impact of System on Singles and their dependence
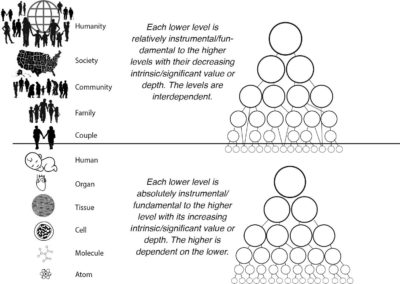
Figure 76. Page 435 Model of the connection between individuals, families, communities and system
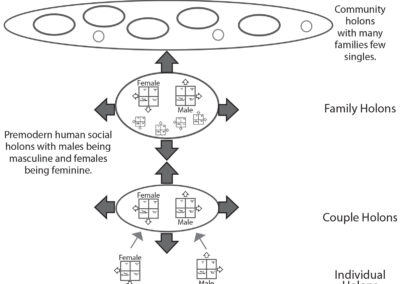
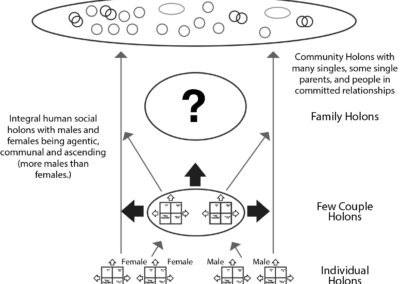
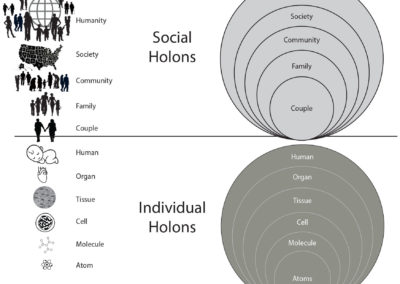
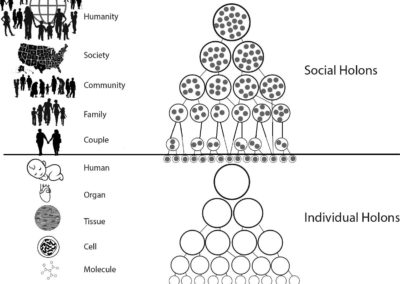
Holonic Structures
Figure 77. Page 437 Social and individual holons
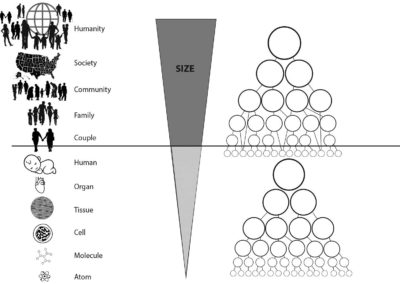
Holons Size
Figure 78. Page 438 Social holons and size
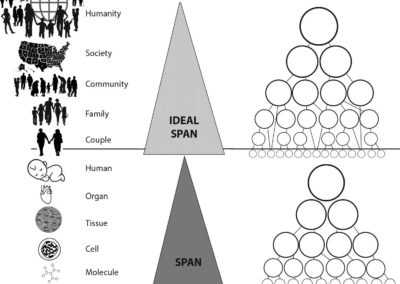
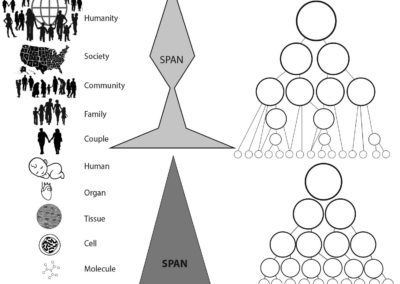
Holons Ideal Span (number of holons)
Figure 79. Page 439 Social holons and span
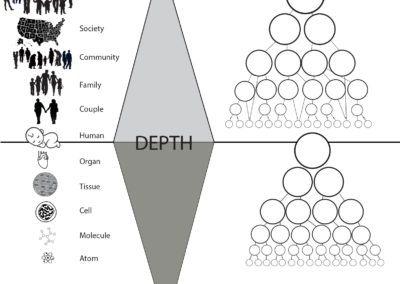
Holon Problematic Greatest Depth
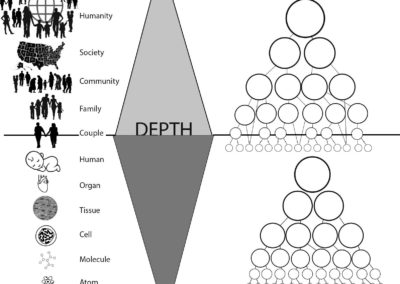
Figure 80. Page 440 Holons and depth
Holon relative and absolute dependence
Figure 81. Page 442 Individual and social holons in the world
Holons Span (number of holons)
Figure 82. Page 443 Flourishing social holons
Modern/Postmodern span problem
Figure 83. Page 444 Holons in collapsing societies
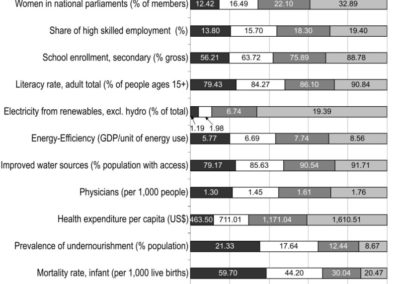
Things that get better (addressed by mythic and modern)
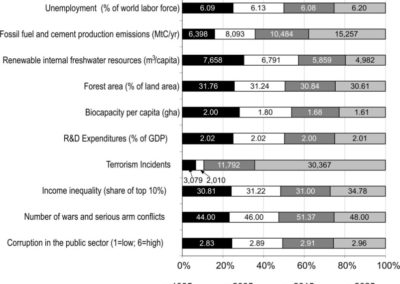
Figure 84. Page 448 Things that are getting better (Glenn and Florescu)
Things that get worse (caused by mythic and modern)
Figure 85. Page 449 Things that are getting worse (Glenn and Florescu)
Elephant curve
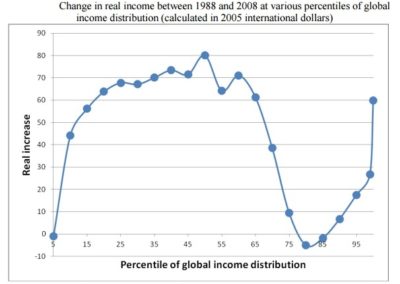
Figure 86. Page 86 The “elephant curve” – income distribution over time
Ideal greatest depth/primacy of couple
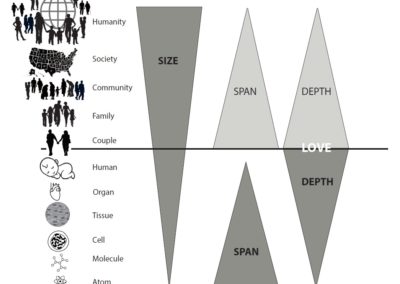
Figure 87. Page 452 Assigning greatest depth to loving couples
Ideal size span depth
Figure 88. Page 453 Couples and holonic structures
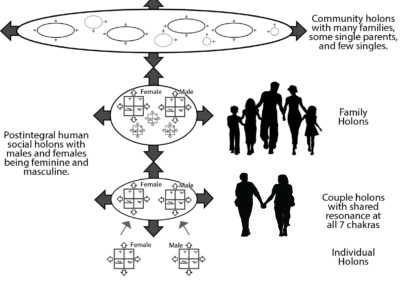
Postintegral Holons
Figure 89. Page 455 Co-creating a new “social holon” through a committed monogamous Integral love relationship
Male/female compassionate rational communicative action model
Figure 90. Page 460 Integrated Compassionate Rational Communicative Action Model
Couple feminine-masculine, all quadrants, all Chakras
Figure 91. Page 461 Communicative Action at the level of all seven Chakras
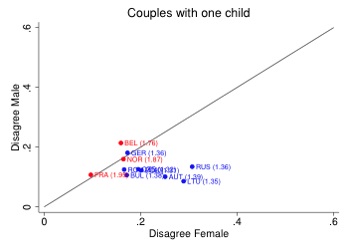
Male help 1 child
Figure 97. Page 477 Couples with only one child correlated with the share of men caring for children
Male help 2+ children
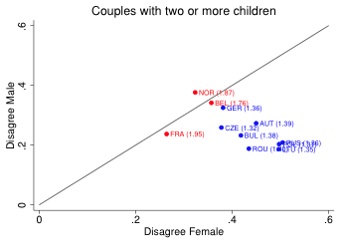
Figure 98. Page 477 Couples with two or more children correlated with the share of men caring for children
Countries by fertility rate
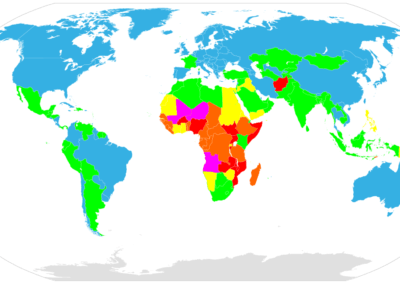
Figure 99. Page 478 Average number of children per woman across the world
Population growth rate
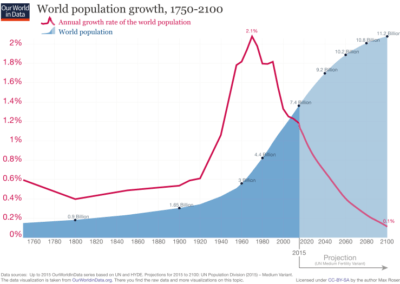
Figure 100. Page 479 Change in worldwide population growth over time
World population forecast
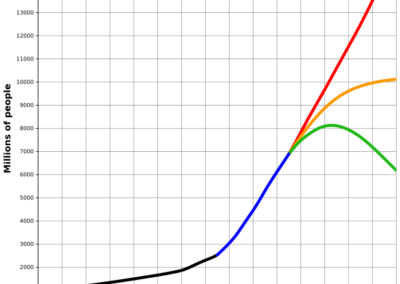
Figure 101. Page 479 Three scenarios proposed by the United Nations for future population growth
Population change by continents
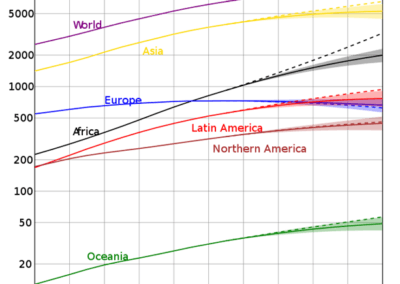
Figure 102. Page 480 (Logarithmic!!) Population change for each continent over time
Fertility rates Europe
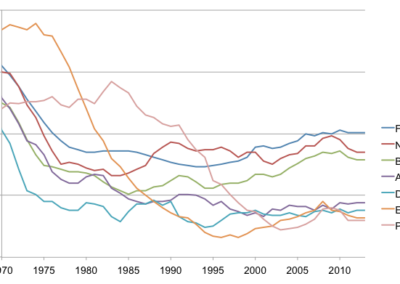
Figure 103. Page 481 Change in fertility rates over time
Fertility rates US
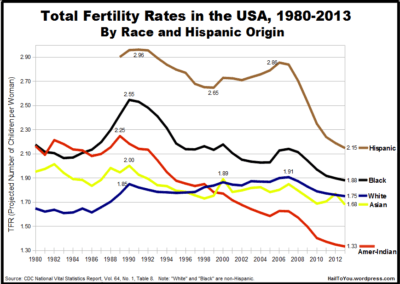
Figure 104. Page 481 Change in fertility rates in the US by race over time
Age marriage and childbearing
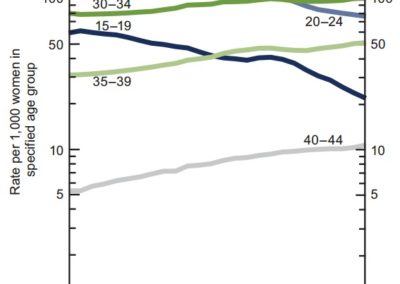
Figure 105. Page 482 Average of marriage and childbearing
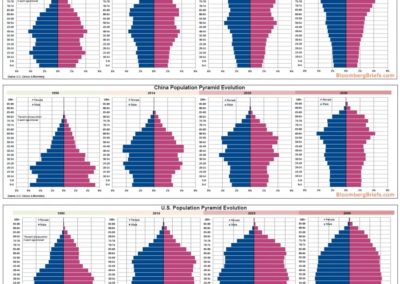
Age pyramids/kites JP CN US
Figure 106. Page 483 Demographic changes in various countries over time
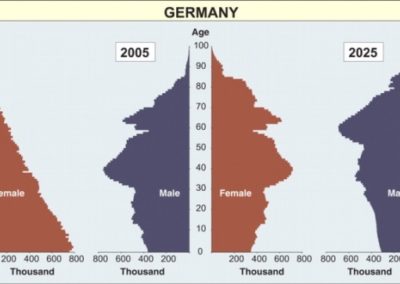
Age pyramid/kite Germany
Figure 106. Page 483 Demographic changes in various countries over time (Germany)
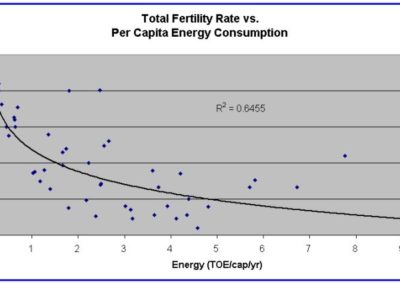
Fertility and energy consumption
Figure 107. Page 484 Fertility rates and energy consumption
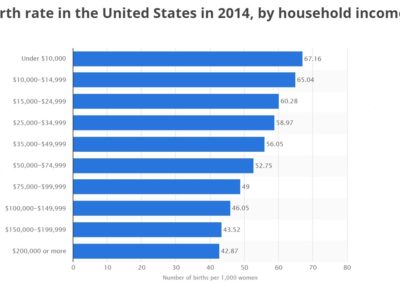
Birthrate and income US
Figure 108. Page 486 US birthrate broken down by income
US Economic Mobility
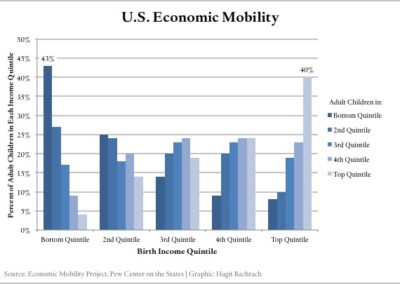
Figure 109. Page 486 Economic mobility by income
US Economic Mobility
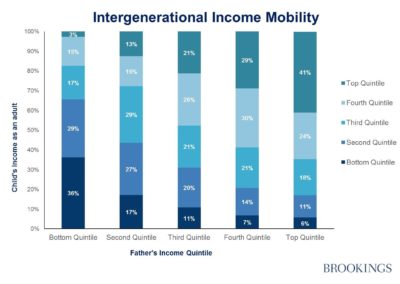
Figure 110. Page 487 Intergenerational income mobility
Economic mobility daughters
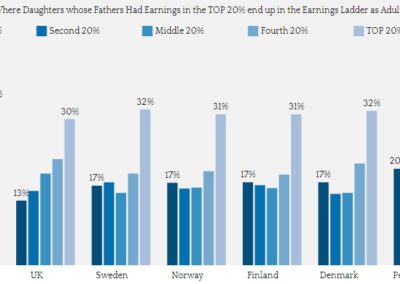
Figure 111. Page 487 Daughters’ economic mobility for lower income Americans
Economic mobility sons
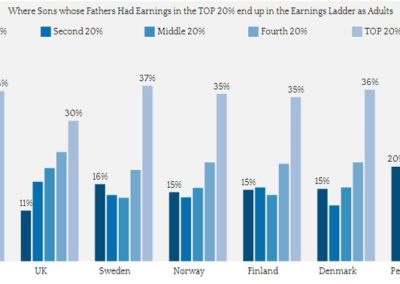
Figure 112. Page 488 Sons’ economic mobility for lower income Americans
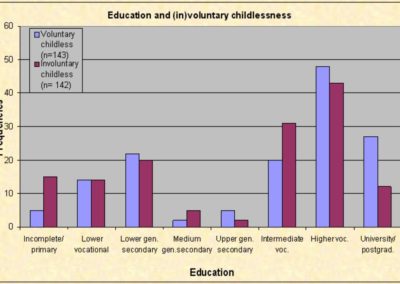
Education and childlessness
Figure 113. Page 489 Education and rates of childlessness
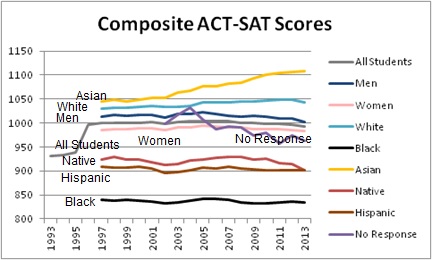
Composite ACT-SAT Scores
Figure 114. Page 489 Change in SAT scores over time, broken down by race
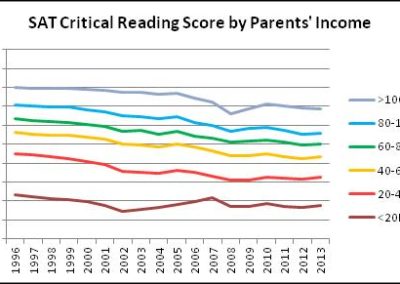
SAT_Income_Reading
Figure 115. Page 490 SAT reading score broken down by parental income
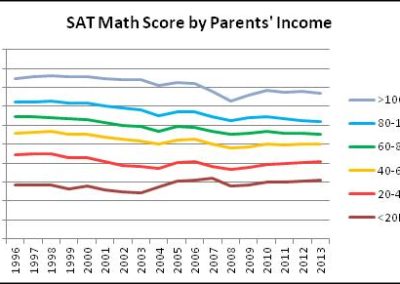
SAT_Income_Math
Figure 116. Page 490 SAT math score broken down by parental income
Sat_Income_Write
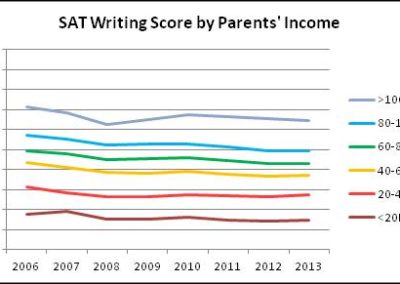
Figure 117. Page 491 SAT writing score broken down by parental income
SAT_Education_Reading
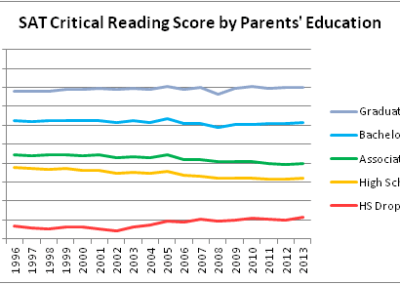
Figure 118. Page 491 SAT reading score broken down by parental education level
SAT_Education_Math
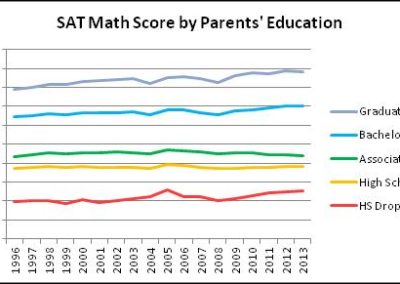
Figure 119. Page 492 SAT math score broken down by parental education level
SAT_Education_Write
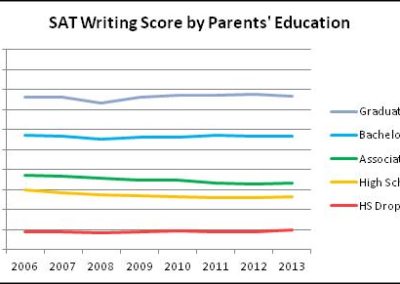
Figure 120. Page 492 SAT writing score broken down by parental education
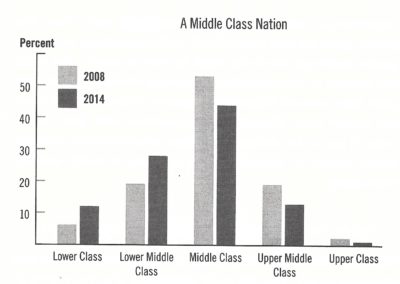
Dream_Hoarders_Class
Figure 121. Page 493 How people self-identify as middle class
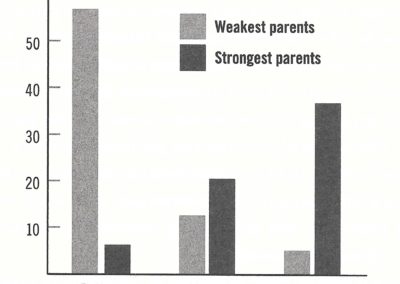
Dream_Hoarders_Parenting
Figure 122. Page 494 Income broken down by parents’ income at their children’s birth
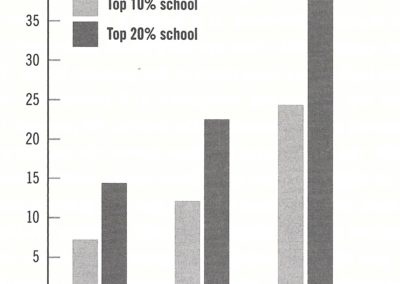
Dream_Hoarders_Schools
Figure 123. Page 495 Income of people who grew up near good schools
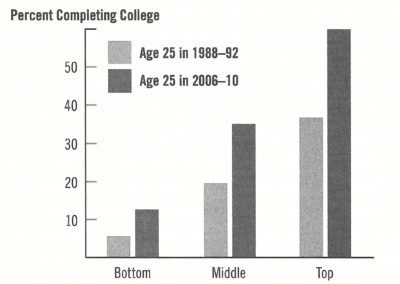
Dream_Hoarders_Graduating
Figure 124. Page 496 College completion rates broken down by income
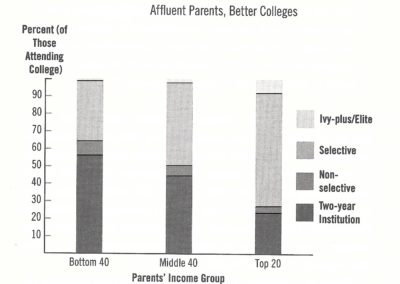
Dream_Hoarders_Colleges
Figure 125. Page 497 Percentage of children attending college, broken down by parent income group
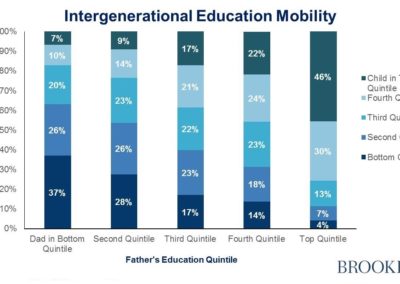
Dream_Hoarders_Father_Education
Figure 126. Page 498 Children’s educational status versus parental educational status
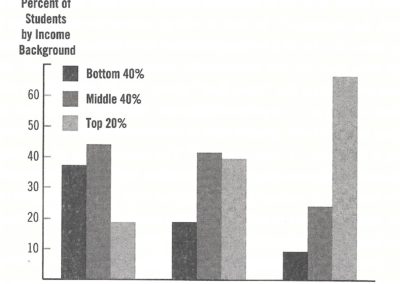
Dream_Hoarders_Elite_Colleges
Figure 127. Page 499 Percentage of children attending elite colleges versus parental income
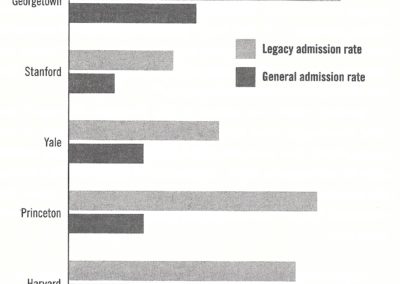
Dream_Hoarders_Elite_Legacy
Figure 128. Page 500 Legacy admission rates for top schools in the US
Education leves relative to parents
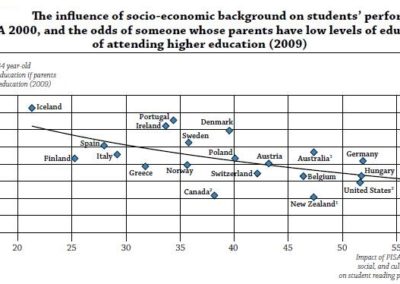
Figure 129. Page 501 Odds of children achieving higher education levels than their parents, by country
GW Bush voters and fertility
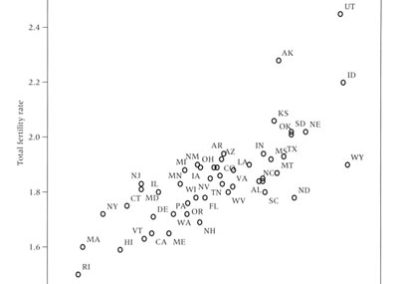
Figure 130. Page 502 Fertility rates vs conservative values
Romney/Obama voters and marriage
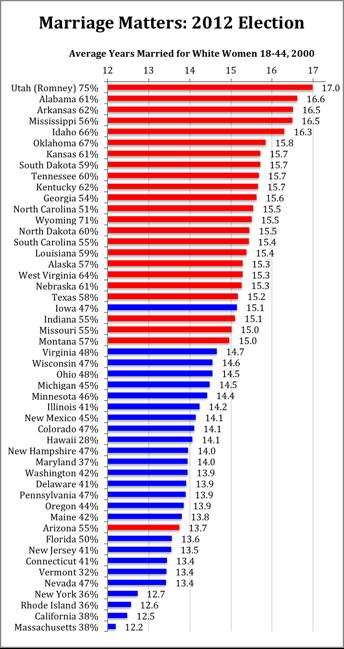
Figure 131. Page 503 Marriage rates vs conservative values
Fertility rates and values
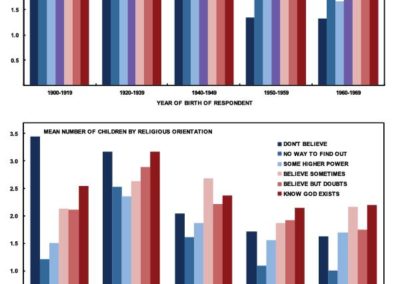
Figure 132. Page 504 Religious values and fertility rates
Fertility and religion
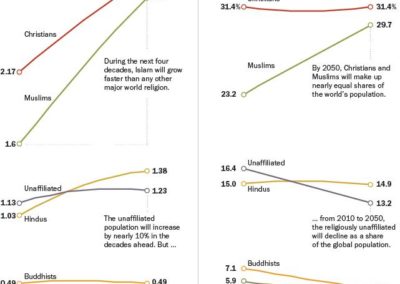
Figure 133. Page 505 Fertility rates by religious affiliation
Population and religion
Figure 134. Page 506 Projected trends in worldwide population growth
US religion trends
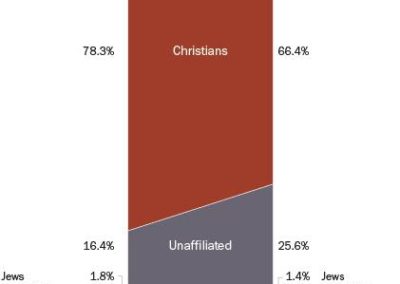
Figure 135. Page 506 Projected change in US religious affiliations 2010-2050
Four religions spiritual levels
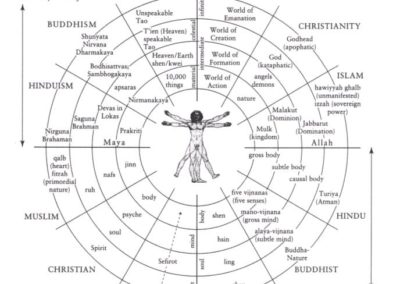
Figure 136. Page 508 A summary of spiritual levels in world religions
Endnote 42: Four quadrant Evolution
Evolution in all four Quadrants
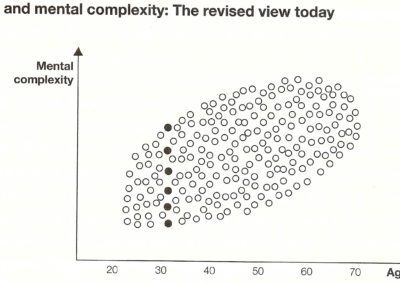
Endnote 94: Age and complexity
Age and mental complexity
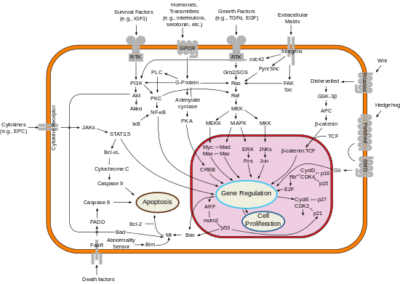
Endnote 376: Cell
Signal transduction pathways in Cells
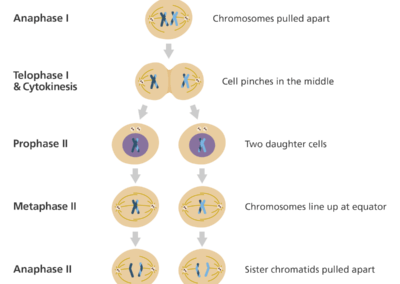
Endnote 384: Meiosis
Meiosis
Endnote 404: Neuron
Neuron (brain cell) with Dendrides, Axon, and Myelination
Endnote 406: Brain
Human Brain
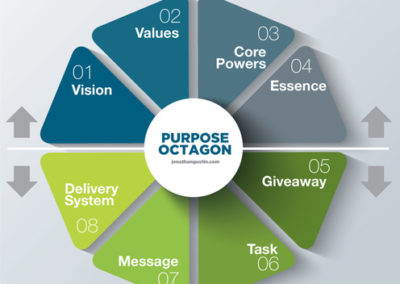
Endnote 506: Gustin’s Purpose Octacon
Jonathan Gustin Purpose Guiding Process https://www.purposeguides.org/
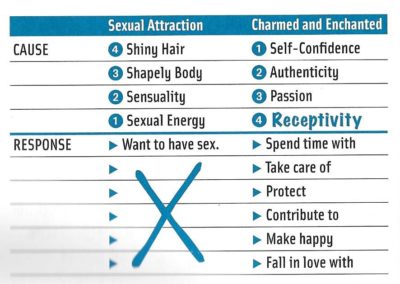
Endnote 567: Armstrong Making Sense Of Men Grid
Alison Armstrong Men want Sex Matrix
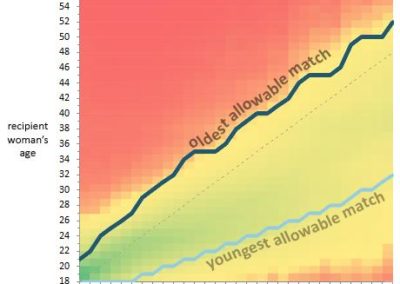
Endnote 571: Date Age Actual
Male preference for younger women
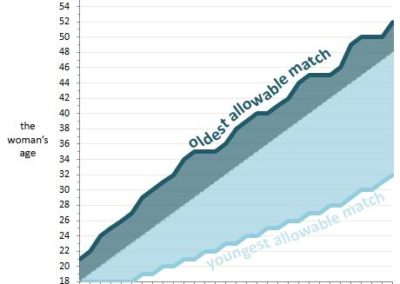
Endnote 571: Date_Age Men
Male preference for younger women
Endnote 574: Non Monogamy
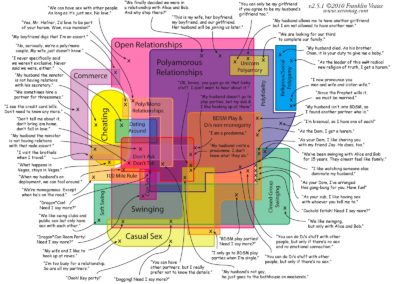
Many forms and names for non-monogamy
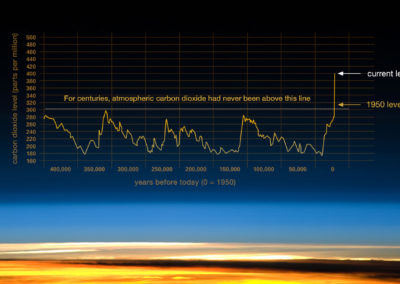
Endnote 619: Carbon levels (NASA)
Carbon Dioxide Levels
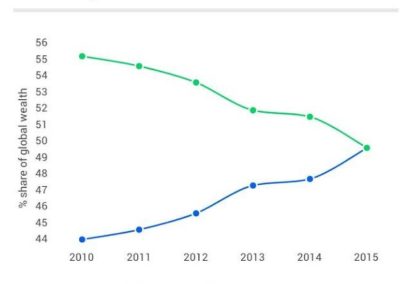
Endnote 627: Wealth distribution
Share of Global Wealth